
Aggregation bias: An experiment with Input-Output data of Canada
Debesh Chakraborty*, Kakali Mukhopadhyay** and Paul Thomassin**
Abstract
The Problem of aggregation in the input-output analysis is an important issue. Aggregation can be defined as a process of operation by which detailed sectors are consolidated into broad sectors, thus reducing the total number of original sectors, no doubt, serves certain purposes. However, the gains obtained from consolidation have to be weighted against the disadvantages (for example, an increase in errors, loss of information of the original sectors) due to aggregation.
Since the early 1950s considerable attention has been given in the literature to formulate aggregation criteria and measure the effects of aggregation of sectors in input-output models. A large amount of theoretical and empirical work has been done to find good aggregation. The present paper examines several measures of the bias or error introduced by aggregation in Input-Output model. The paper uses Input-Output table of Canada for the year 2003 as an example to measure the basis effects of aggregation.
Originally the Use and Make table of Canada consists of 697 commodities, 16 primary inputs, 286 industries, and 168 final demand categories at Worksheet level. For the purpose of the aggregation error study, we have aggregated 697 commodities into 125 including 25 detail agricultural commodities. 16 primary inputs have been aggregated to 11. Like commodities, the scheme of detailed agricultural sector has also been applied to industry aggregation in make and use table of Canada. The Industries are aggregated to 84 from 286, and final demand to 7 categories from 168 including private consumption, investment, change in stock, govt. expenditure, export, re-export and import. Thus Use matrix consists of 125 commodities and 84 industries, 11 primary inputs and 7 final demand categories; and Make matrix consists of 84 industries and 125 commodities. Next the paper estimates the bias due to the aggregation scheme in the input-output table of Canada.
The results show that the estimation of the bias due to the aggregation of input-output table varies across the sectors. For most of the sectors the error is marginal, though for some the size is not negligible. The paper also discusses the implication of the result for the use of the input-output model.
* Department of Economics, Jadavpur University, Calcutta-700032, India
**Department of Agricultural Economics, McGill University, MacDonald Campus, 21, 111 Lakeshore, Ste Anne de Bellevue, Montreal Quebec, Canada
Paper submitted for the 18th International Input-output Conference, Sydney, Australia, 20-25, June, 2010
1. Introduction
The problem of aggregation is an important theoretical and empirical issue in the input-output analysis.
Aggregation can be defined as a process or operation by which detailed sectors are consolidated into broad sectors, thus reducing the total number of original sectors. The output, input and coefficients of the group represent, in general, the average (weighted) of those of the original detailed sectors belonging to the group. In this aggregated model, besides several groups, there may be some original sectors. In any case, all the sectors in the aggregated model are usually denoted as aggregate sectors. “Aggregation is a matter of degree, since the original sectors are never, in practice, as detailed as is possible in principle” (McManus, 1956, p.29)
Aggregation of the detailed sectors, no doubt, serves certain purposes1. However, the gains obtained from consolidation have to be weighed against the disadvantages (e.g., an increase in errors, loss of information of the original sectors) due to aggregation. Of course, how far the given amount of expected error is undesirable depends on the specific purpose for which the model is constructed.
A considerable amount of theoretical and empirical work has been done in the area of aggregation problem in the Input-Output analysis. The objective of the present paper is to study the problem of aggregation in input-output model with input-output data of Canada. In particular, we will investigate the measures of the bias or error introduced by aggregation and carryout experiment with input-output table of Canada for the year 2003. The paper will be organized as follows. In section II, the aggregation problem will be formally presented and it will deal with the measures of aggregation bias, the conditions of zero bias as developed by researchers. In section III we will carryout the empirical work with Canada’s input-output data. Section IV concludes the paper.
2. Mathematical Formulation of the Aggregation Problems and Measures of Aggregation Bias in Input-Output Model
In this paper “Recent Developments in the Study of Inter-Industrial Relationships” (Leontief, 1951), Leontief points out the essence of the aggregation problem with a simple example. Let us assume that there were one hundred “industrial” sectors in the economy. They form the original sectors. With the help of the input-output model one can determine the influence of a change in the final demand for cars upon the net output of papers. Now, if the sectors other than the car and the paper industries are consolidated in some way, we obtain a new system, called the hybrid system. If the hybrid system shows the same relationship between the final demand for cars and the new output of paper as the original one, then the consolidation introduced is acceptable. Leontief also carefully points out that what may be an acceptable aggregation scheme for a given purpose may no longer be so from different points of view. He states: “There are many alternative ways of aggregating the ninety-eight (basic classification) original industries under some forty-eight broader headings. Each reclassification will lead to a different system of fifty simultaneous equations and most likely also to a different solution. By comparing these alternative short-cut answers with the known correct solution of our problem, on the one hand, and with each other, it is possible to measure the comparative “goodness”, i.e., operational efficiency, of alternative aggregating classifications of the ninety-eight basic industries. Considerable theoretical as well as experimental work in the problem of industrial classification is being done along these lines" (Leontief, 1951, p. 217).
Following Leontief’s example and illuminating ideas since the early 1950’s considerable attention has been given in the literature to establishing criteria for and measuring the effects of aggregation of sectors in input-output models. Hatanaka (1952), followed by Ara (1959), Malinvaud (1956), McManus (1956), Theil (1957) and Morimoto (1970, 1971) recently, Kymn (1990), Cabrer, Contreras and Miravete (1991), and Olsen (1993) did a considerable amount of theoretical work on formal properties of the problem of aggregation bias and error, conditions for consistent aggregation, etc. [For review of the literature please see Chakraborty and ten Raa (1981) and Kymn (1990)]
Section 2.1 : The Agrregation Matrix and Measures of Agreegation Bias
Before examining the effects of aggregation let us develop a mathematical formulation of aggregation of sectors in input-output table.
Define
g = column vector of output gi
(i = 1, …….m)
f = column vector of final demands fi
(i = 1, …….m)
A = input-output coefficient matrix of the original system
= [aij] (i, j = 1, ……..m)
A* = input-output coefficient matrix of the aggregated system
= [aIJ] (I, J = 1, ………n)
n ≤ m
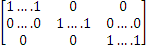
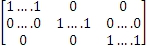
T = aggregational operator
= 
Hence, the original static Leontief system (before aggregation) is
g = (I – A) -1 f . . . . (1)
And the aggregated system
g* = (I-A)-1 f* . . . . (2)
Where
f* = Tf
2.1.1 Measures of Aggregation Bias
The “aggregation bias” can be defined as the difference between the vector of outputs which are derived from the aggregated system and those which are derived by aggregating the total outputs in the original disaggregated system. Thus the aggregation bias can be defined as :
E = g* - Tg (3)
= [I – A*] -1f* - T [I – A]-1f
= [I – A*]-1Tf – T [I – A]-1f
= Vf (4)
where V = [I – A*]-1T – T[I – A]-1 . . . . (5)
Expanding the inverse matrices in (5), we obtain
Vf = [(I – A* + A*2 + . . . .)T - T(I + A + A2 + . . . .)]f
= [(A*T – TA) + (A*2 – TA2) + . . . .] f (6)
The “first order aggregation bias”2 can be defined as
E = (A*T – TA)f = 
 f (7)
f (7)
where 
 = A*T – TA
Theorem : The aggregation bias vanishes (i.e.,E) for any final demand if and only if the coefficient matrix satisfied the condition A*T = TA .
This follows from the expression for E in (6) since, if A*T = TA, then
A*2T – TA2 = A*A*T – TAA = A*(TA) – (A*T)A = 0
and similarly, for higher-order terms in the series. This theorem suggests that if two (or more) sectors have identical inter industry structures (i.e., equal columns in the A matrix, then aggregation of these sectors will result in zero total aggregation bias.
This condition was first formulated by Hatanaka3 (1952) and its interpretation was elaborated by McManus (1956), Theil (1957) and Ara (1959).
All the above discussions are based on the basic idea- how to achieve “perfect aggregation”- implied in theorem of homogeneity of input structure. That is, the aggregated coefficients of a macro sector are not affected by changes in the production pattern within the macro sector.
This requirement, especially, cannot always be fulfilled for practical application. Researchers have tried to find ways for “best aggregation”. Several attempts Fisher (1958), Theil and Uribe (1967) Ghosh and Sarkar (1970), Kossov (1972), Blin and Cohen (1977), Kymn (1977), have been made in this direction.
3. Empirical Work with the input-output data of Canada
In this Section an attempt has been made to estimate the aggregation error using the input-output data of Canada for the year 2003.
3.1 Mathematical Derivation of the Input-Output Model Canada
The simple form of the square input-output model developed by Leontief is based on a transaction table where each industry produces one commodity and each commodity is produced by only one industry4.
The Canadian input-output model is based on a more complex accounting framework where the number of industries does not equal the number of commodities (for additional details on the model, see; Thomassin et al 1992, 2000). With this framework, each industrial sector can produce more than one commodity. The rectangular accounting framework consist of five matrices: intermediate demand matrix, U, primary inputs, YI, the market share matrix, V, a final demand matrix, F, and a primary inputs matrix going into final demand categories, YF. Within this accounting framework there are a number of relationships that can be used to estimate the input-output model.
The first is that the mX 1 vector of the value of industrial output, g, is equal to the summation of the value of each commodity produced by each industrial sector, Vi, where V is an m X n matrix:
g = Vi (where i is a vector of 1’s) (8)
The second relationship defines the disposition of commodities to categories of demand. The total demand for commodities in the economy, q, an nX 1 vector, is equal to the intermediate demand for commodities,
U, an nX m matrix, plus the final demand for commodities, F, an n X k matrix:
q = Ui + Fi (9)
Using these two relationships and making a number of assumptions, the input-output model can be estimated. The first assumption relates to industrial technology. It is assumed
that current inputs used by each industry are proportional to the output produced by that industry:
U = Bˆg (10)
It is also assumed that the demand for commodities produced in the economy is allocated
to industries in fixed market shares:
V = Dˆq (11)
Combining these relationships we can develop the input-output model and solve for the level of industry output as shown by equation (12) (additional details on the mathematical derivation of the model can be found in Thomassin et al 1992; Miller and Blair 1985, 2009):
g = (I – DB)–1 DFi (12)
Using the same assumption of industrial technology we can also construct a commodity by commodity input-output model and solve for the commodity output as shown by eq. 13
q = (I – BD)–1 Fi (13)
3.2 Aggregation scheme of Input-output data of Canada for the year 2003
We have used Worksheet level make and use table of Canada at basic price for the year 2003 (STAT Canada). Originally the table consists of 697 commodities, 16 primary input, 286 industries, and 168 final demand categories.
For the empirical work on aggregation problem we have aggregated 697 commodities into 125 including 25 detail agricultural commodities according to modified worksheet level. The mining and petroleum commodities are also considered at disaggregated level. The rest of the commodities have been aggregated according to the medium level aggregation of I-O table of Canada. 16 primary inputs have been aggregated to 11.
Like commodities, the scheme of detailed agricultural sector and mining and petroleum has also been applied to industry aggregation. Finally Industries are aggregated to 84 from 286, and final demand to 7categories from 168 including private consumption, investment, change in stock, govt. expenditure, export, re-export and import .
Thus Use matrix consists of 125 commodities and 84 industries, 11 primary inputs and 7 final demand categories; and Make matrix consists of 84 industries, 125 commodities.
3.3 Experiments
Using these two aggregated input-output data (use matrix and make matrix) of Canada for the year 2003 two experiments on estimation of the aggregation error has been carried out
First, using the equation 12 the vector of output of 84 industries has been calculated and then it has been compared with the actual output for the 84 industries aggregated from the original input-output data. The size of the error is calculated using the formula

The result is shown in Appendix 1
Second, using the eq. 13 the vector of output of 125 commodities has been estimated and it has been compared with the vector of output of 125 commodities obtained by aggregating the original input-output data. The size of a error is estimated and in presented in Appendix 2.
3.4 Discussion of the results
For the sake of convenience we have arranged the size of the errors by range and is presented in Table 1 and 2.
It is observed from Table 1 that the size of the aggregation errors varies across the 84 industries. The effect of aggregation is very small for the 35 industries where the error lies between 0.00-0.20. Only few industries (5) like Health Care and Social Assistance, Other Municipal Government Services, Pharmaceutical and Medicine Manufacturing, Other Provincial and Territorial Government Services, Other Federal Government Services, the size of the error is high lying above 2.00. Others lie between 0.40 to 2.00.
Similarly from Table 2 which presents the effect of aggregation by different range for the 125 commodities the error is found to very small for 77 commodities lying between 0.00 to 0.20. Only for the very few commodities (The health & social services; pharmaceuticals the size of the error is high and lies above 2.00. Others are between 0.20 to 2.00.
4. Conclusion
The purpose of this paper is to shed light on the consistent aggregation error in input-output model by using rectangular matrices of Canada. The results show that the estimation of the bias due to the aggregation of input-output table varies across the sectors. For most of the sectors the error is marginal, though for same the size is not negligible. Whoever it is notice that the size of the error is large for service sectors. Some other studies also found that error size is large particularly for service sector. The results thus imply that most of the industries/commodities aggregated in the two experiments followed the principle implied by the theorem of homogeneity of input structure as develop in section 2.1.1. For input - output studies data on service sector need improvement which would likely to minimize the aggregation bias.
Table 1
The name of the industries belonging to different range of aggregation error
|
Name of the Industries |
Range of aggregation
error |
|
Furniture and Related Product Manufacturing |
0.00-0.20 |
|
Wheat |
|
Fishing, Hunting and Trapping |
|
Oilseed |
|
Potatoes |
|
Animal Aquaculture |
|
Wood Product Manufacturing |
|
Universities and Government Education Services |
|
Beverage and Tobacco Product Manufacturing |
|
Fruits & Vegetables |
|
Transportation Equipment Manufacturing |
|
Forestry and Logging |
|
Hogs |
|
Greenhouse, Nursery and Floriculture Production |
|
Poultry and eggs |
|
Transportation Margins |
|
Food Manufacturing |
|
Construction |
|
Other Crops |
|
Cattle |
|
Dairy |
|
Other livestock |
|
Pipeline Transportation |
|
Feed grain |
|
Accommodation and Food Services |
|
Oil and Gas Extraction |
|
Pesticides, Fertilizer and Other Agricultural Chemical Manufacturing |
|
Retail Trade |
|
Support Activities for Mining and Oil and Gas Extraction |
|
Paper Manufacturing |
|
Clothing Manufacturing |
|
Finance, Insurance, Real Estate and Rental and Leasing |
|
non metalic mineral mining |
|
Non-Metallic Mineral Product Manufacturing |
|
metal ore mining |
|
Asphalt Paving, Roofing and Saturated Materials Manufacturing |
0.20-0.40 |
|
Primary Metal Manufacturing |
|
Hospitals and Residential Care Facilities |
|
Motion Picture and Sound Recording Industries |
|
Arts, Entertainment and Recreation |
|
Petroleum Refineries and Other Petroleum and Coal Products Manufacturing |
|
Plastics and Rubber Products Manufacturing |
|
Fabricated Metal Products Manufacturing |
|
Wholesale Trade |
|
Textile and Textile Product Mills |
|
Truck Transportation |
|
Transit and Ground Passenger Transportation |
|
Electric Power Generation, Transmission and Distribution |
|
Other Transportation |
|
Leather and Allied Product Manufacturing |
|
Warehousing and Storage |
|
Non-Profit Education Institutions |
|
Machinery Manufacturing |
|
Personal and Laundry Services and Private Households |
|
Industrial Gas Manufacturing |
|
other basic Chemical and Manufacturing |
0.40-0.60 |
|
Petrochemical Manufacturing |
|
Broadcasting and Telecommunications |
|
Coal Mining |
|
Support Activities for Forestry |
|
Support Activities for Crop Production |
|
Electrical Equipment, Appliance and Component Manufacturing |
|
Publishing Industries, Information Services and Data Processing Services |
|
Non-Profit Institutions Serving Households (Excluding Education) |
|
Support Activities for Animal Production |
|
Printing and Related Support Activities |
|
Waste Management and Remediation Services |
|
Miscellaneous Manufacturing |
|
Natural Gas Distribution |
|
Repair and Maintenance |
|
Water, Sewage and Other Systems |
|
Postal Service and Couriers and Messengers |
|
Administrative and Support Services |
|
Professional, Scientific and Technical Services |
|
Computer and Electronic Product Manufacturing |
|
Grant-Making, Civic, and Professional and Similar Organizations |
|
Operating, Office, Cafeteria and Laboratory Supplies |
|
Educational Services |
|
Travel, Entertainment, Advertising and Promotion |
0.60-2.00 |
|
Health Care and Social Assistance |
2.00-above |
|
Other Municipal Government Services |
|
Pharmaceutical and Medicine Manufacturing |
|
Other Provincial and Territorial Government Services |
|
Other Federal Government Services |
Source: Computed from Appendix 1
Table 2
The name of the commodities belonging to different range of aggregation error
|
Name of the Commodities |
Range of aggregation error |
|
Cigarettes and other tobacco products |
0.00-0.20 |
|
Residential building construction |
|
Non-residential construction |
|
Gross imputed rent |
|
Services provided by non-profit institutions serving households, except education services |
|
Education services provided by non-profit institutions serving households |
|
Government funding of hospital and residential care facilities |
|
Government funding of education |
|
Defense services |
|
Other provincial government services |
|
Other federal government services |
|
Other municipal government services |
|
Motor vehicles, mobile homes and trailers and semi-trailers |
|
Furniture and fixtures |
|
Hay and straw, excluding imputed feed |
|
Raw wool and mink skins |
|
Soft drinks |
|
Wheat, unmilled, excluding imputed feed |
|
Fruit and vegetable products |
|
Wood pulp |
|
Lumber and timber |
|
Canola |
|
Breakfast cereal and bakery products and food snacks |
|
Fish and seafood products |
|
Hunting and trapping products |
|
Other grains, excluding imputed feed |
|
Plywood and veneer |
|
Fish and seafood fresh, chilled or frozen |
|
Dairy products, mayonnaise, salad dressing and mustard |
|
Potatoes, fresh or chilled |
|
Other vegetables, fresh or chilled |
|
Fertilizers |
|
Alcoholic beverages |
|
Other live animals |
|
Forestry Products |
|
Honey and beeswax |
|
Meat products |
|
Feeds |
|
other wood products |
|
Barley, excluding imputed feed |
|
Boilers, tanks, and plates |
|
Eggs in the shell |
|
Raw tobacco |
|
Fresh fruit, excluding tropical |
|
Natural gas, excluding liquefied |
|
Cattle and calves |
|
Hogs |
|
Unmanufactured tobacco |
|
Soybeans and other oil seeds |
|
Nursery stock, flowers, and other horticulture products |
|
Retailing margins and services |
|
Wheat flour and starches |
|
Miscellaneous food products |
|
Poultry |
|
Transportation margins |
|
Corn fodder, imputed feed |
|
Wheat, unmilled, imputed feed |
|
Other grains and fodder, imputed feed |
|
Hay and straw, imputed feed |
|
Fluid milk, unprocessed |
|
Sugar |
|
Cement, ready-mix concrete and concrete products |
|
Structural and prefab. metal building prod. |
|
Pipeline transportation |
|
Services incidental to mining |
|
Accommodation services and meals |
|
Motor vehicle parts |
|
Hosiery and knitted clothing |
|
Grain corn, excluding imputed feed |
|
Appliances and household equipment |
|
Motor gasoline |
|
Iron ores and concentrates |
|
Newsprint and other paper, excluding coated paper and paper products |
|
Light fuel oil |
|
Liquified petroleum gas |
|
Crude mineral oils |
|
Miscellaneous metal ores and concentrates |
|
Other rubber products |
0.20-0.40 |
|
Primary products of non-ferrous metals |
|
Seeds, excluding oil seeds |
|
Non-metallic minerals |
|
Other non-metallic mineral products |
|
Other clothing and accessories |
|
Wholesaling margins |
|
Other textile products |
|
Plastics products |
|
Amusement and recreation services |
|
Diesel oil |
|
Finance, insurance, and real estate services |
|
Primary products of iron and steel |
|
All other miscellaneous manufactured products |
|
Coated paper and paper products |
|
Agricultural machinery |
|
Other transportation and storage |
|
Other petroleum and coal products |
|
Electric power |
|
Other transport equipment and repairs |
|
Heavy fuel oil |
|
Fabrics |
|
Other fabricated metal products |
|
Leather and leather products |
|
Radio and television broadcasting, including cable |
|
Other machinery |
|
Tires and tubes |
|
Business and computer services |
|
Yarns and fibres |
|
Industrial chemicals |
0.40-0.60 |
|
Coal |
|
Other chemical products |
|
Telephone and other telecommunication services |
|
Agricultural services |
|
Printed products and publishing service |
|
Other utilities |
|
Postal and courier services |
|
Other electrical and electronic products |
|
Operating, office, cafeteria and laboratory supplies |
|
Other services |
|
Education, tuition and other fees services |
0.60-2.00 |
|
Travel, entertainment, advertising and promotion |
|
Advertising in print media |
|
Aviation fuel |
|
Repair construction |
|
Scientific, laboratory, medical and photographic equipment and instruments and medical and ophthalmic goods |
|
Health and social services |
2.00-above |
|
Pharmaceuticals |
Footnotes
1. For example, some minimum levels of aggregation may be required even before the data collection for the model starts as (i) the detailed data may not be obtainable and (ii) the cost of collection, sorting, processing and tabulating the data may be reduced. When the model is ready, further aggregation may be suggested depending on the specific objective of the model construction. Aggregation may also save some computing time.
2. The definition to first order aggregation bias is due to Theil (1957, p.117).
3. Hatanaka actually derived two conditions: (a) the microsectors aggregated into the same macro sector must not have mutual transactions and (b) they must also have the same cost structure vis-à-vis all other macro sectors when prices of original commodities are used as weights of aggregation. However, McManus (1956) later on proved the first condition to be unnecessary when the gross method (without eliminating intra-sector transfers) are used or when the net outputs of aggregated sectors are defined properly to eliminate such mutual transactions. Ara (1959) has further shown that for the acceptability of aggregation, it is not necessary (but sufficient) that the input coefficient of the industrial sectors to be aggregated should be completely the same.
4. Eq. 1a provides the equilibrium condition that can be used to estimate the vector of gross output, g, of the m industrial sectors that is necessary to satisfy the mX1 final demand, f, and the intermediate industrial demand, Ag:
g = Ag + f (1a)
In this equation, A is an mX m matrix of technical coefficients. Solving for Eq. 1 gives:
g = (I – A)–1f (1b)
where I is an mX m identity matrix. The expression (I – A)-1 is referred to as the Leontief inverse and can be used to estimate the direct plus indirect output requirements to satisfy a change in final demand.
References
Ara, Kenjiro. 1959. “The Aggregation Problem in Input-Output Analysis”, Econometrica, 27 257- 262.
Blin, J.M. and Cohen, C. (1977).“Technological Similarity and Aggregation in Input-Output Systems: A Cluster Analytic Approach”. Review of Economics and Statistics, Feb.
Cabrer, B., D. Contreras and Eugenio J. Miravete. 1991. “Aggregation in Input-Output Tables: How to Select the Best Cluster Linkage”, Economic Systems Research, 3, 99-109.
Chakraborty, Debesh and ten Raa, Thijs, 1981 “Agrregation Problem in Input-Output Analysis – A Survey”, Artha Vijnana, Vol. 23, No. 3 &4 , 326-344.
Fisher, W. (1958). “Criteria for Aggregation in Input-Output Analysis”. The Review of Economics and Statistics, Vol.40, No.3, Aug., pp.250-60
Ghosh, A. and Sarkar, H. (1970). “An Input-Output Matrix as a Special Configuration”. Economics of Planning, Vol.10, pv.01-2, pp.133-42.
Hatanaka, M. 1952. “Note on Consolidation within a Leontief System”, Econometrica, 20, 301-303.
Kossov, V.V. (1970). “The Theory of Aggregation in Input-Output Models”. Carter and Brody (eds.), Vol.I, Input-output Technique, North-Holland.
Kymn, Kern O. 1990. “Aggregation in Input-Output Models: A Comprehensive Review, 1946-1971”, Economic Systems Research, 2, 65-93.
Kymn, Kern, O (1977). “Inter-industry Energy Demand and Aggregation of Input-Output tables”. Review of Economics and Statistics, Aug.
Leontief, W. (1951). The Structure of the American Economy, 1919-1939, Oxford University Press, pp.202-216.
Malinvaud, E. 1956. “Aggregation Problems in Input-Output Models”, in Tibor Barna (ed.), The Structural Interdependence of the Economy. New York: Wiley, pp. 189-202.
McManus, M. 1956. “General Consistent Aggregation in Leontief Models”, Yorkshire Bulletin of Economic and Social Research, 8, 28-48.
Miller, Ronald E. and Peter D. Blair. 1985. Input-Output Analysis: Foundations and Extensions. Englewood Cliffs, NJ: Prentice-Hall.
Miller, Ronald E. and Peter D. Blair. 2009. Input-Output Analysis: Foundations and Extensions (2nd edition). Cambridge University Press, U.K.
Morimoto, Y. (1971). “A Note on Weighted Aggregation in Input-Output Analysis”. The Review of Economic Studies, Vol.37, No.109, Feb., pp.119-126.
Morimoto, Y. 1970. “On Aggregation Problems in Input-Output Analysis”, Review of Economic Studies, 37, 119-126.
Olsen, J. Asger. 1993. “Aggregation in Input-Output Models: Prices and Quantities”, Economic Systems Research, 5, 253-275.
Theil, H. and Uribe, P. (1967). “The Information Approach to the Aggregation of Input-Output Tables”. The Review of Economics and Statistics, Vol. XLIX, No.4, pp.457-62.
Theil, Henri. 1957. “Linear Aggregation in Input-Output Analysis”, Econometrica, 25, 111-122.
Thomassin,Paul J., and Laurie Baker. 2000. "Macroeconomic Impacts of Establishing a Large Scale Fuel Ethanol Plant on the Canadian Economy", Canadian Journal of Agricultural Economics 48: 67-85.
Thomassin,Paul J., John C. Henning and Laurie Baker. 1992. "Macroeconomic Impacts of an Agro-ethanol Industry in Canada". Canadian Journal of Agricultural Economics 40: 295-310.
Appendix 1
|
Name of the Industry |
Industry computed output
|
Industry actual output
|
Size of the error
|
|
|
% change |
|
Greenhouse, Nursery and Floriculture Production |
2953.901 |
2957 |
0.1048 |
|
Wheat |
3479.272 |
3481 |
0.049653 |
|
Feed grain |
3565.797 |
3571 |
0.145715 |
|
Oilseed |
3208.699 |
3211 |
0.071659 |
|
Potatoes |
1024.226 |
1025 |
0.075523 |
|
Fruits & Vegetables |
1220.853 |
1222 |
0.093889 |
|
Other Crops |
4269.748 |
4275 |
0.122844 |
|
Animal Aquaculture |
762.4109 |
763 |
0.077202 |
|
Dairy |
4611.245 |
4617 |
0.124652 |
|
Cattle |
6335.129 |
6343 |
0.124096 |
|
Hogs |
3541.34 |
3545 |
0.103241 |
|
Poultry and eggs |
2461.198 |
2464 |
0.1137 |
|
Other livestock |
951.6947 |
953 |
0.13697 |
|
Forestry and Logging |
12191.66 |
12204 |
0.101093 |
|
Fishing, Hunting and Trapping |
2379.531 |
2381 |
0.061697 |
|
Support Activities for Crop Production |
358.4206 |
360 |
0.438722 |
|
Support Activities for Animal Production |
381.2424 |
383 |
0.458904 |
|
Support Activities for Forestry |
1443.744 |
1450 |
0.431416 |
|
Oil and Gas Extraction |
81636.92 |
81759.08 |
0.149409 |
|
Coal Mining |
1292.555 |
1298 |
0.419487 |
|
metal ore mining |
8461.217 |
8478 |
0.197962 |
|
non metalic mineral mining |
6330.013 |
6342 |
0.189008 |
|
Support Activities for Mining and Oil and Gas Extraction |
9928.329 |
9945 |
0.16763 |
|
Electric Power Generation, Transmission and Distribution |
33804.01 |
33902 |
0.289034 |
|
Natural Gas Distribution |
3984.234 |
4003 |
0.468809 |
|
Water, Sewage and Other Systems |
628.9962 |
632 |
0.475285 |
|
Construction |
151807.5 |
151993 |
0.122077 |
|
Food Manufacturing |
69173.6 |
69257.05 |
0.120494 |
|
Beverage and Tobacco Product Manufacturing |
13338.53 |
13350 |
0.085884 |
|
Textile and Textile Product Mills |
6818.37 |
6837 |
0.272483 |
|
Clothing Manufacturing |
8067.728 |
8082 |
0.176587 |
|
Leather and Allied Product Manufacturing |
853.4107 |
856 |
0.302489 |
|
Wood Product Manufacturing |
32897.05 |
32922.99 |
0.078786 |
|
Paper Manufacturing |
34443.2 |
34502 |
0.170407 |
|
Printing and Related Support Activities |
12890.55 |
12950 |
0.459111 |
|
Asphalt Paving, Roofing and Saturated Materials Manufacturing |
1675.154 |
1679 |
0.229062 |
|
Petroleum Refineries and Other Petroleum and Coal Products Manufacturing |
39172.63 |
39270 |
0.247943 |
|
Petrochemical Manufacturing |
3841.444 |
3857 |
0.403317 |
|
Industrial Gas Manufacturing |
629.5028 |
632 |
0.395127 |
|
Pesticides, Fertilizer and Other Agricultural Chemical Manufacturing |
2804.684 |
2809 |
0.153654 |
|
Pharmaceutical and Medicine Manufacturing |
10965.03 |
11221.05 |
2.281608 |
|
other basic Chemical and Manufacturing |
30063.9 |
30185 |
0.401195 |
|
Plastics and Rubber Products Manufacturing |
26307.27 |
26373 |
0.249245 |
|
Non-Metallic Mineral Product Manufacturing |
12579.36 |
12604 |
0.195476 |
|
Primary Metal Manufacturing |
37646.45 |
37733 |
0.229374 |
|
Fabricated Metal Products Manufacturing |
32673.19 |
32755 |
0.249776 |
|
Machinery Manufacturing |
28637.78 |
28745 |
0.373003 |
|
Computer and Electronic Product Manufacturing |
22592.99 |
22715 |
0.537115 |
|
Electrical Equipment, Appliance and Component Manufacturing |
10042.28 |
10088 |
0.453178 |
|
Transportation Equipment Manufacturing |
124007.6 |
124131 |
0.099415 |
|
Furniture and Related Product Manufacturing |
13842.17 |
13848 |
0.042095 |
|
Miscellaneous Manufacturing |
9331.319 |
9375 |
0.465934 |
|
Wholesale Trade |
100183.7 |
100443 |
0.258149 |
|
Retail Trade |
99433.77 |
99590 |
0.156872 |
|
Truck Transportation |
28780.77 |
28861 |
0.277995 |
|
Transit and Ground Passenger Transportation |
6036.836 |
6054 |
0.283512 |
|
Pipeline Transportation |
6867.557 |
6877 |
0.137315 |
|
Other Transportation |
35785.91 |
35893 |
0.298365 |
|
Postal Service and Couriers and Messengers |
10025.78 |
10077 |
0.508284 |
|
Warehousing and Storage |
2567.185 |
2575 |
0.303484 |
|
Motion Picture and Sound Recording Industries |
6796.664 |
6813 |
0.239779 |
|
Broadcasting and Telecommunications |
38724.41 |
38884 |
0.410435 |
|
Publishing Industries, Information Services and Data Processing Services |
20109.38 |
20201 |
0.453544 |
|
Finance, Insurance, Real Estate and Rental and Leasing |
310669 |
311247 |
0.185705 |
|
Professional, Scientific and Technical Services |
83472.83 |
83909 |
0.519813 |
|
Administrative and Support Services |
36863.86 |
37054 |
0.513143 |
|
Waste Management and Remediation Services |
3774.516 |
3792 |
0.461068 |
|
Educational Services |
3301.167 |
3321 |
0.597185 |
|
Health Care and Social Assistance |
35886.95 |
36649 |
2.079309 |
|
Arts, Entertainment and Recreation |
17089.17 |
17131 |
0.244179 |
|
Accommodation and Food Services |
51484.77 |
51560 |
0.145908 |
|
Repair and Maintenance |
14609.3 |
14679 |
0.474807 |
|
Personal and Laundry Services and Private Households |
12446.07 |
12495 |
0.391589 |
|
Grant-Making, Civic, and Professional and Similar Organizations |
3425.458 |
3444 |
0.53839 |
|
Operating, Office, Cafeteria and Laboratory Supplies |
58615.47 |
58933 |
0.538805 |
|
Travel, Entertainment, Advertising and Promotion |
47604.83 |
47894 |
0.603778 |
|
Transportation Margins |
27826.03 |
27859 |
0.11834 |
|
Non-Profit Institutions Serving Households (Excluding Education) |
21339.02 |
21437 |
0.457079 |
|
Non-Profit Education Institutions |
2539.163 |
2548 |
0.346802 |
|
Hospitals and Residential Care Facilities |
48432.08 |
48544 |
0.230559 |
|
Universities and Government Education Services |
62928.24 |
62978 |
0.079019 |
|
Other Municipal Government Services |
41651.1 |
42605 |
2.238931 |
|
Other Provincial and Territorial Government Services |
72626.17 |
75675.84 |
4.029903 |
|
Other Federal Government Services |
46281.48 |
48824 |
5.207518 |
|
calculated total int use |
|
|
|
Appendix 2
|
Name of the commodities |
Commodity Computed output |
Actual total output |
Size of the error |
|
Cattle and calves |
5473.821 |
5479 |
0.094527 |
|
Hogs |
3321.775 |
3325 |
0.096999 |
|
Poultry |
1734.958 |
1737 |
0.117561 |
|
Other live animals |
334.7442 |
335 |
0.076363 |
|
Wheat, unmilled, excluding imputed feed |
3183.958 |
3185 |
0.032705 |
|
Wheat, unmilled, imputed feed |
188.7761 |
189 |
0.118458 |
|
Grain corn, excluding imputed feed |
778.835 |
780 |
0.149354 |
|
Corn fodder, imputed feed |
163.8059 |
164 |
0.118382 |
|
Barley, excluding imputed feed |
645.4293 |
646 |
0.088342 |
|
Other grains, excluding imputed feed |
412.7726 |
413 |
0.055061 |
|
Other grains and fodder, imputed feed |
1325.417 |
1327 |
0.119298 |
|
Fluid milk, unprocessed |
4486.603 |
4492 |
0.120152 |
|
Eggs in the shell |
568.4848 |
569 |
0.090553 |
|
Honey and beeswax |
233.8104 |
234 |
0.081026 |
|
Fresh fruit, excluding tropical |
564.4782 |
565 |
0.092352 |
|
Potatoes, fresh or chilled |
992.3573 |
993 |
0.064727 |
|
Other vegetables, fresh or chilled |
2245.426 |
2247 |
0.070061 |
|
Hay and straw, excluding imputed feed |
139.9809 |
140 |
0.013658 |
|
Hay and straw, imputed feed |
2501.012 |
2504 |
0.119317 |
|
Seeds, excluding oil seeds |
70.85184 |
71 |
0.208681 |
|
Nursery stock, flowers, and other horticulture products |
1977.847 |
1980 |
0.108716 |
|
Canola |
2147.033 |
2148 |
0.045009 |
|
Soybeans and other oil seeds |
1002.915 |
1004 |
0.108077 |
|
Raw tobacco |
213.805 |
214 |
0.091101 |
|
Raw wool and mink skins |
51.9879 |
52 |
0.023268 |
|
Agricultural services |
5555.376 |
5581 |
0.459135 |
|
Forestry Products |
11636.87 |
11646 |
0.078417 |
|
Fish and seafood fresh, chilled or frozen |
2766.287 |
2768 |
0.061892 |
|
Hunting and trapping products |
21.9879 |
22 |
0.054998 |
|
Iron ores and concentrates |
1377.81 |
1380 |
0.158678 |
|
Miscellaneous metal ores and concentrates |
9394.372 |
9413 |
0.197897 |
|
Coal |
1269.683 |
1275 |
0.416981 |
|
Crude mineral oils |
36627.24 |
36696 |
0.187373 |
|
Natural gas, excluding liquefied |
37021.55 |
37056 |
0.092956 |
|
Non-metallic minerals |
5160.42 |
5172 |
0.223894 |
|
Services incidental to mining |
9345.257 |
9358 |
0.136175 |
|
Meat products |
20434.75 |
20452 |
0.084327 |
|
Dairy products, mayonnaise, salad dressing and mustard |
10826.14 |
10833 |
0.063287 |
|
Fish and seafood products |
4985.377 |
4988 |
0.052588 |
|
Fruit and vegetable products |
6873.665 |
6876 |
0.033958 |
|
Feeds |
6500.382 |
6506 |
0.08635 |
|
Wheat flour and starches |
1058.82 |
1060 |
0.111319 |
|
Breakfast cereal and bakery products and food snacks |
7343.392 |
7347 |
0.049111 |
|
Sugar |
824.9888 |
826 |
0.122419 |
|
Miscellaneous food products |
9420.932 |
9432 |
0.117342 |
|
Soft drinks |
2830.217 |
2831 |
0.027643 |
|
Alcoholic beverages |
13996.44 |
14007 |
0.075423 |
|
Unmanufactured tobacco |
272.7277 |
273 |
0.099726 |
|
Cigarettes and other tobacco products |
2995 |
2995 |
0 |
|
Tires and tubes |
2686.254 |
2696 |
0.361511 |
|
Other rubber products |
2446.014 |
2451 |
0.203421 |
|
Plastics products |
12715.92 |
12746 |
0.236028 |
|
Leather and leather products |
746.5568 |
749 |
0.326189 |
|
Yarns and fibres |
1576.926 |
1583 |
0.383685 |
|
Fabrics |
2044.746 |
2051 |
0.304934 |
|
Other textile products |
3433.133 |
3441 |
0.228632 |
|
Hosiery and knitted clothing |
5862.544 |
5871 |
0.144023 |
|
Other clothing and accessories |
2139.143 |
2144 |
0.226543 |
|
Lumber and timber |
13733.37 |
13739 |
0.040972 |
|
Plywood and veneer |
2357.565 |
2359 |
0.060846 |
|
other wood products |
17892.38 |
17908 |
0.087231 |
|
Furniture and fixtures |
11339.57 |
11340 |
0.003765 |
|
Wood pulp |
7756.195 |
7759 |
0.036154 |
|
Newsprint and other paper, excluding coated paper and paper products |
16646.49 |
16673 |
0.158989 |
|
Coated paper and paper products |
12209.17 |
12240 |
0.251844 |
|
Printed products and publishing service |
15242.22 |
15315 |
0.475201 |
|
Advertising in print media |
5811.694 |
5847 |
0.603833 |
|
Primary products of iron and steel |
18608.74 |
18655.04 |
0.24819 |
|
Primary products of non-ferrous metals |
19143.39 |
19182.81 |
0.205509 |
|
Boilers, tanks, and plates |
1925.291 |
1927 |
0.088668 |
|
Structural and prefab. metal building prod. |
6845.685 |
6855 |
0.135891 |
|
Other fabricated metal products |
19933.66 |
19996.59 |
0.31472 |
|
Agricultural machinery |
2005.555 |
2011 |
0.270749 |
|
Other machinery |
24373 |
24457.03 |
0.343562 |
|
Motor vehicles, mobile homes and trailers and semi-trailers |
69841.49 |
69842 |
0.000728 |
|
Motor vehicle parts |
41431.33 |
41491 |
0.143806 |
|
Other transport equipment and repairs |
17500.02 |
17552 |
0.296163 |
|
Appliances and household equipment |
2573.139 |
2577 |
0.149816 |
|
Other electrical and electronic products |
22246.71 |
22365 |
0.52891 |
|
Cement, ready-mix concrete and concrete products |
5948.475 |
5956 |
0.126346 |
|
Other non-metallic mineral products |
5582.396 |
5595 |
0.225268 |
|
Motor gasoline |
16140.87 |
16166 |
0.155437 |
|
Aviation fuel |
1499.6 |
1512 |
0.820131 |
|
Diesel oil |
9291.021 |
9314 |
0.246716 |
|
Light fuel oil |
1631.15 |
1634 |
0.174393 |
|
Heavy fuel oil |
1291.091 |
1295 |
0.301848 |
|
Liquified petroleum gas |
6215.702 |
6227 |
0.181428 |
|
Other petroleum and coal products |
9865.946 |
9893.633 |
0.279845 |
|
Fertilizers |
4121.081 |
4124 |
0.070773 |
|
Industrial chemicals |
20938.18 |
21024 |
0.408212 |
|
Pharmaceuticals |
7970.081 |
8224 |
3.087535 |
|
Other chemical products |
10862.86 |
10908.77 |
0.420934 |
|
Scientific, laboratory, medical and photographic equipment and instruments and medical and ophthalmic goods |
5806.814 |
5880 |
1.244653 |
|
All other miscellaneous manufactured products |
11165.67 |
11193.49 |
0.248563 |
|
Repair construction |
21444.14 |
21624 |
0.831767 |
|
Residential building construction |
56797 |
56797 |
0 |
|
Non-residential construction |
72205 |
72205 |
0 |
|
Other transportation and storage |
74664.14 |
74872 |
0.277626 |
|
Pipeline transportation |
6814.711 |
6824 |
0.13612 |
|
Radio and television broadcasting, including cable |
9546.986 |
9579 |
0.334206 |
|
Telephone and other telecommunication services |
25568.6 |
25679 |
0.42994 |
|
Postal and courier services |
9669.493 |
9719 |
0.509382 |
|
Electric power |
33291.62 |
33387.84 |
0.288187 |
|
Other utilities |
13886.52 |
13953 |
0.476486 |
|
Wholesaling margins |
94733.38 |
94948.84 |
0.226926 |
|
Retailing margins and services |
94665.92 |
94769 |
0.108765 |
|
Gross imputed rent |
94459 |
94459 |
0 |
|
Finance, insurance, and real estate services |
211158.5 |
211680.8 |
0.246738 |
|
Education, tuition and other fees services |
11483.58 |
11553 |
0.600876 |
|
Health and social services |
45330.77 |
46302 |
2.097589 |
|
Amusement and recreation services |
20116.81 |
20166 |
0.243936 |
|
Accommodation services and meals |
43438.6 |
43500 |
0.14115 |
|
Business and computer services |
54085.18 |
54286.35 |
0.370573 |
|
Other services |
145269.7 |
146111.8 |
0.576313 |
|
Operating, office, cafeteria and laboratory supplies |
82952.72 |
83402.1 |
0.538805 |
|
Transportation margins |
27826.03 |
27859 |
0.11834 |
|
Travel, entertainment, advertising and promotion |
47604.83 |
47894 |
0.603778 |
|
Services provided by non-profit institutions serving households, except education services |
9673 |
9673 |
0 |
|
Education services provided by non-profit institutions serving households |
4110 |
4110 |
0 |
|
Government funding of hospital and residential care facilities |
43407 |
43407 |
0 |
|
Government funding of education |
53463 |
53463 |
0 |
|
Defense services |
11897 |
11897 |
0 |
|
Other municipal government services |
31536 |
31536 |
1.44E-05 |
|
Other provincial government services |
69095 |
69095 |
0 |
|
Other federal government services |
31594 |
31594 |
0 |